

How we secure AI in your organization: Detect, Policy, and Enforce
Shadow AI is the new shadow IT. We built AI Agent Monitoring to give you a four-stage framework that takes you from zero visibility to full governance across every AI tool and agent your teams use.
Ask your CISO how many AI tools are running inside your org right now. They won't know the real number. Nobody does.
Claude, ChatGPT, Copilot, Gemini, custom MCP servers, internal agents wired up to LLM APIs. Your teams are using all of them. Some are sanctioned. Most aren't. And the count doubles every few months.
We've been calling this "shadow AI," but that undersells the problem. Shadow IT was people spinning up unauthorized SaaS apps. Shadow AI is people handing sensitive data, code execution, and system access to tools with zero oversight. The blast radius is in a different league.
So we built AI Agent Monitoring. Four stages that take you from "we have no idea what's running" to full governance across every AI tool and agent in your org.
Stage 1: Discover. Find Every AI Tool and Agent in Your Environment.
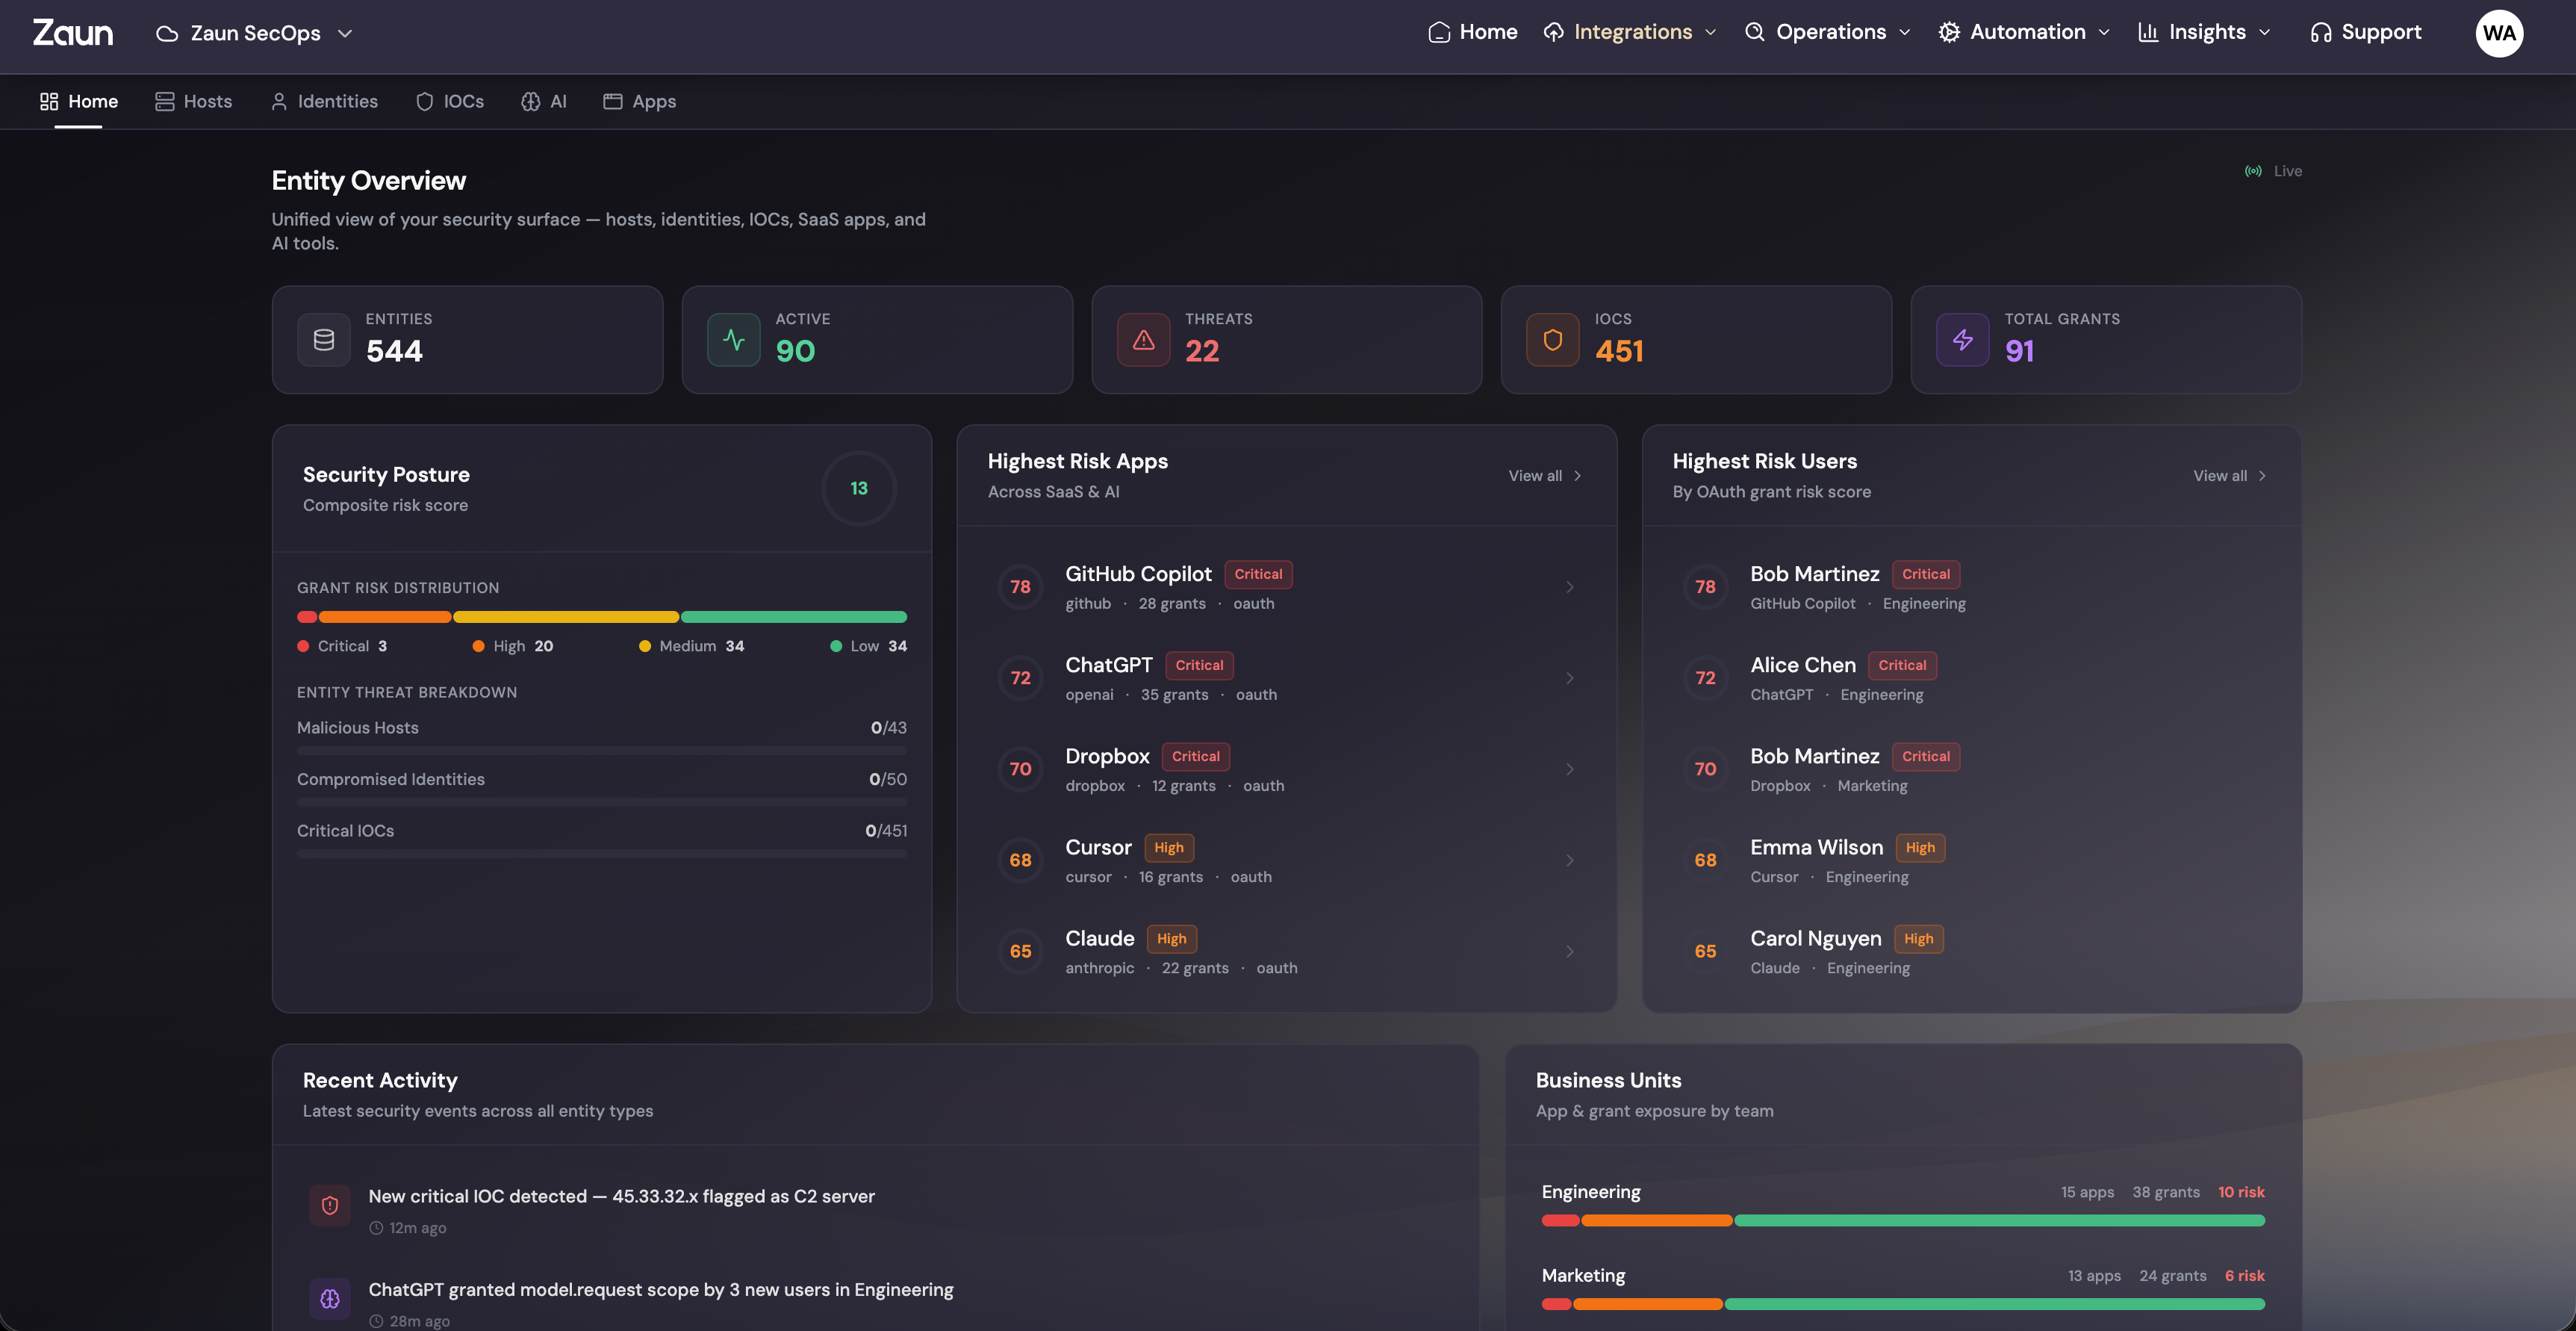
You can't govern what you can't see. Stage one is building a complete, continuously updated inventory of every AI tool, agent, and integration your people are actually using.
How We Find Them
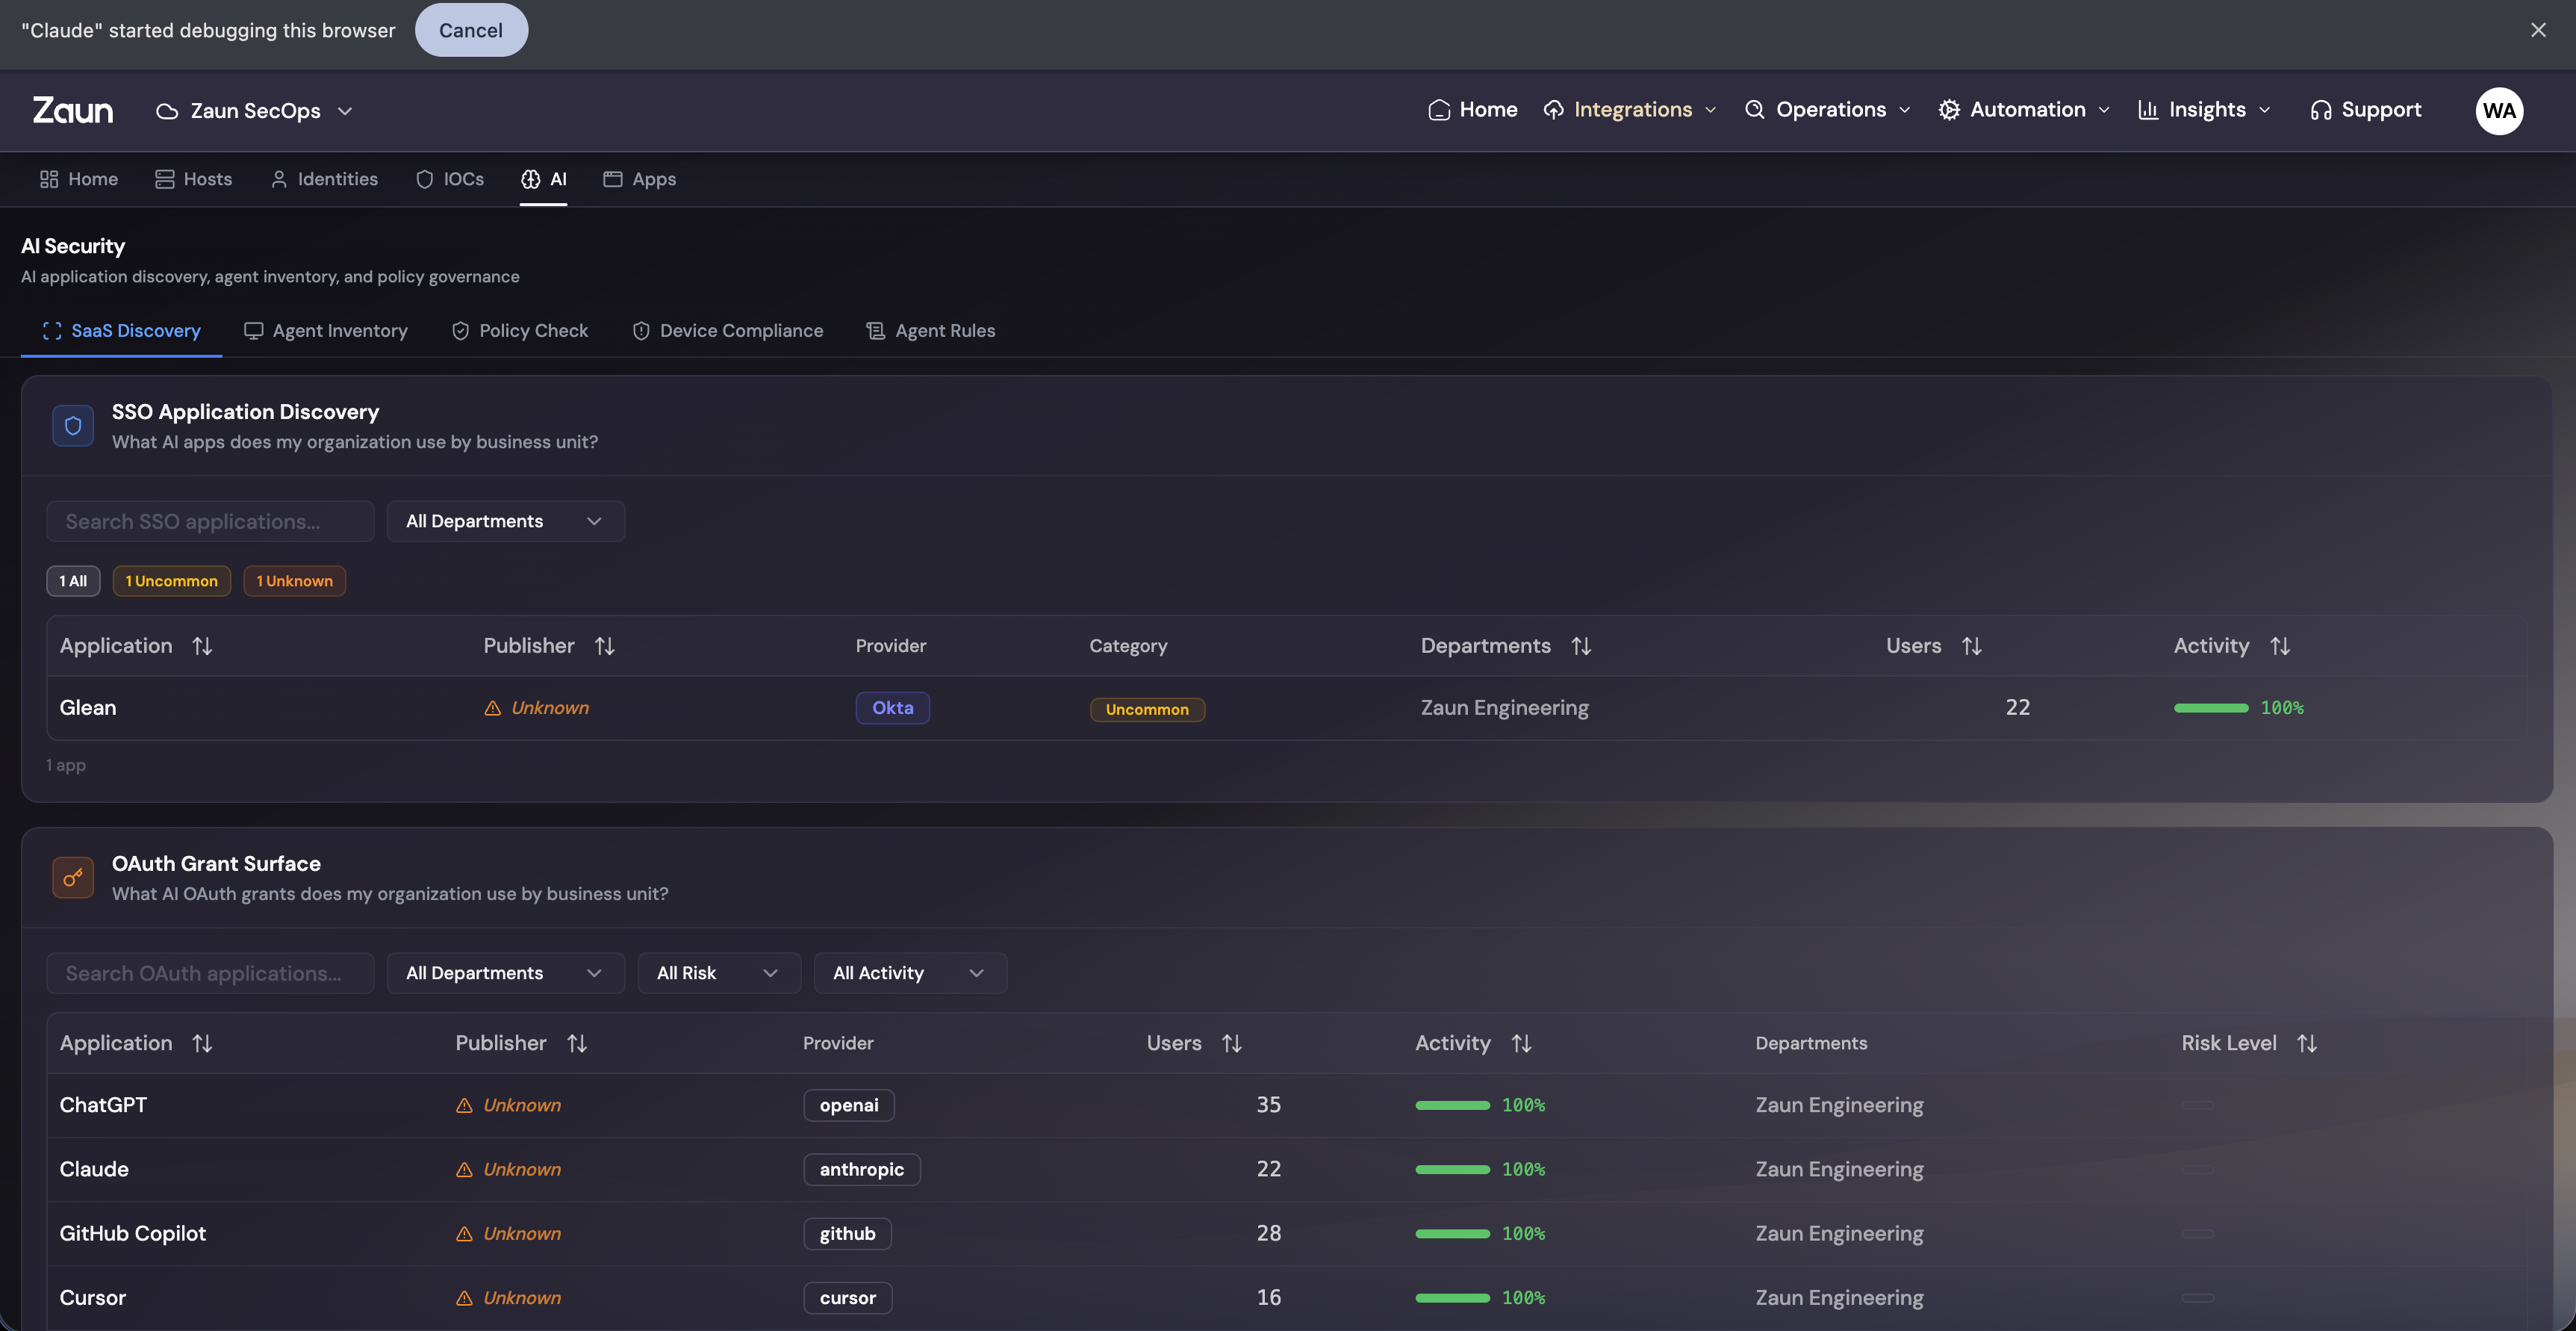
Most AI discovery approaches stop at checking which SaaS apps are on the approved list. That misses almost everything. We look at three layers:
-
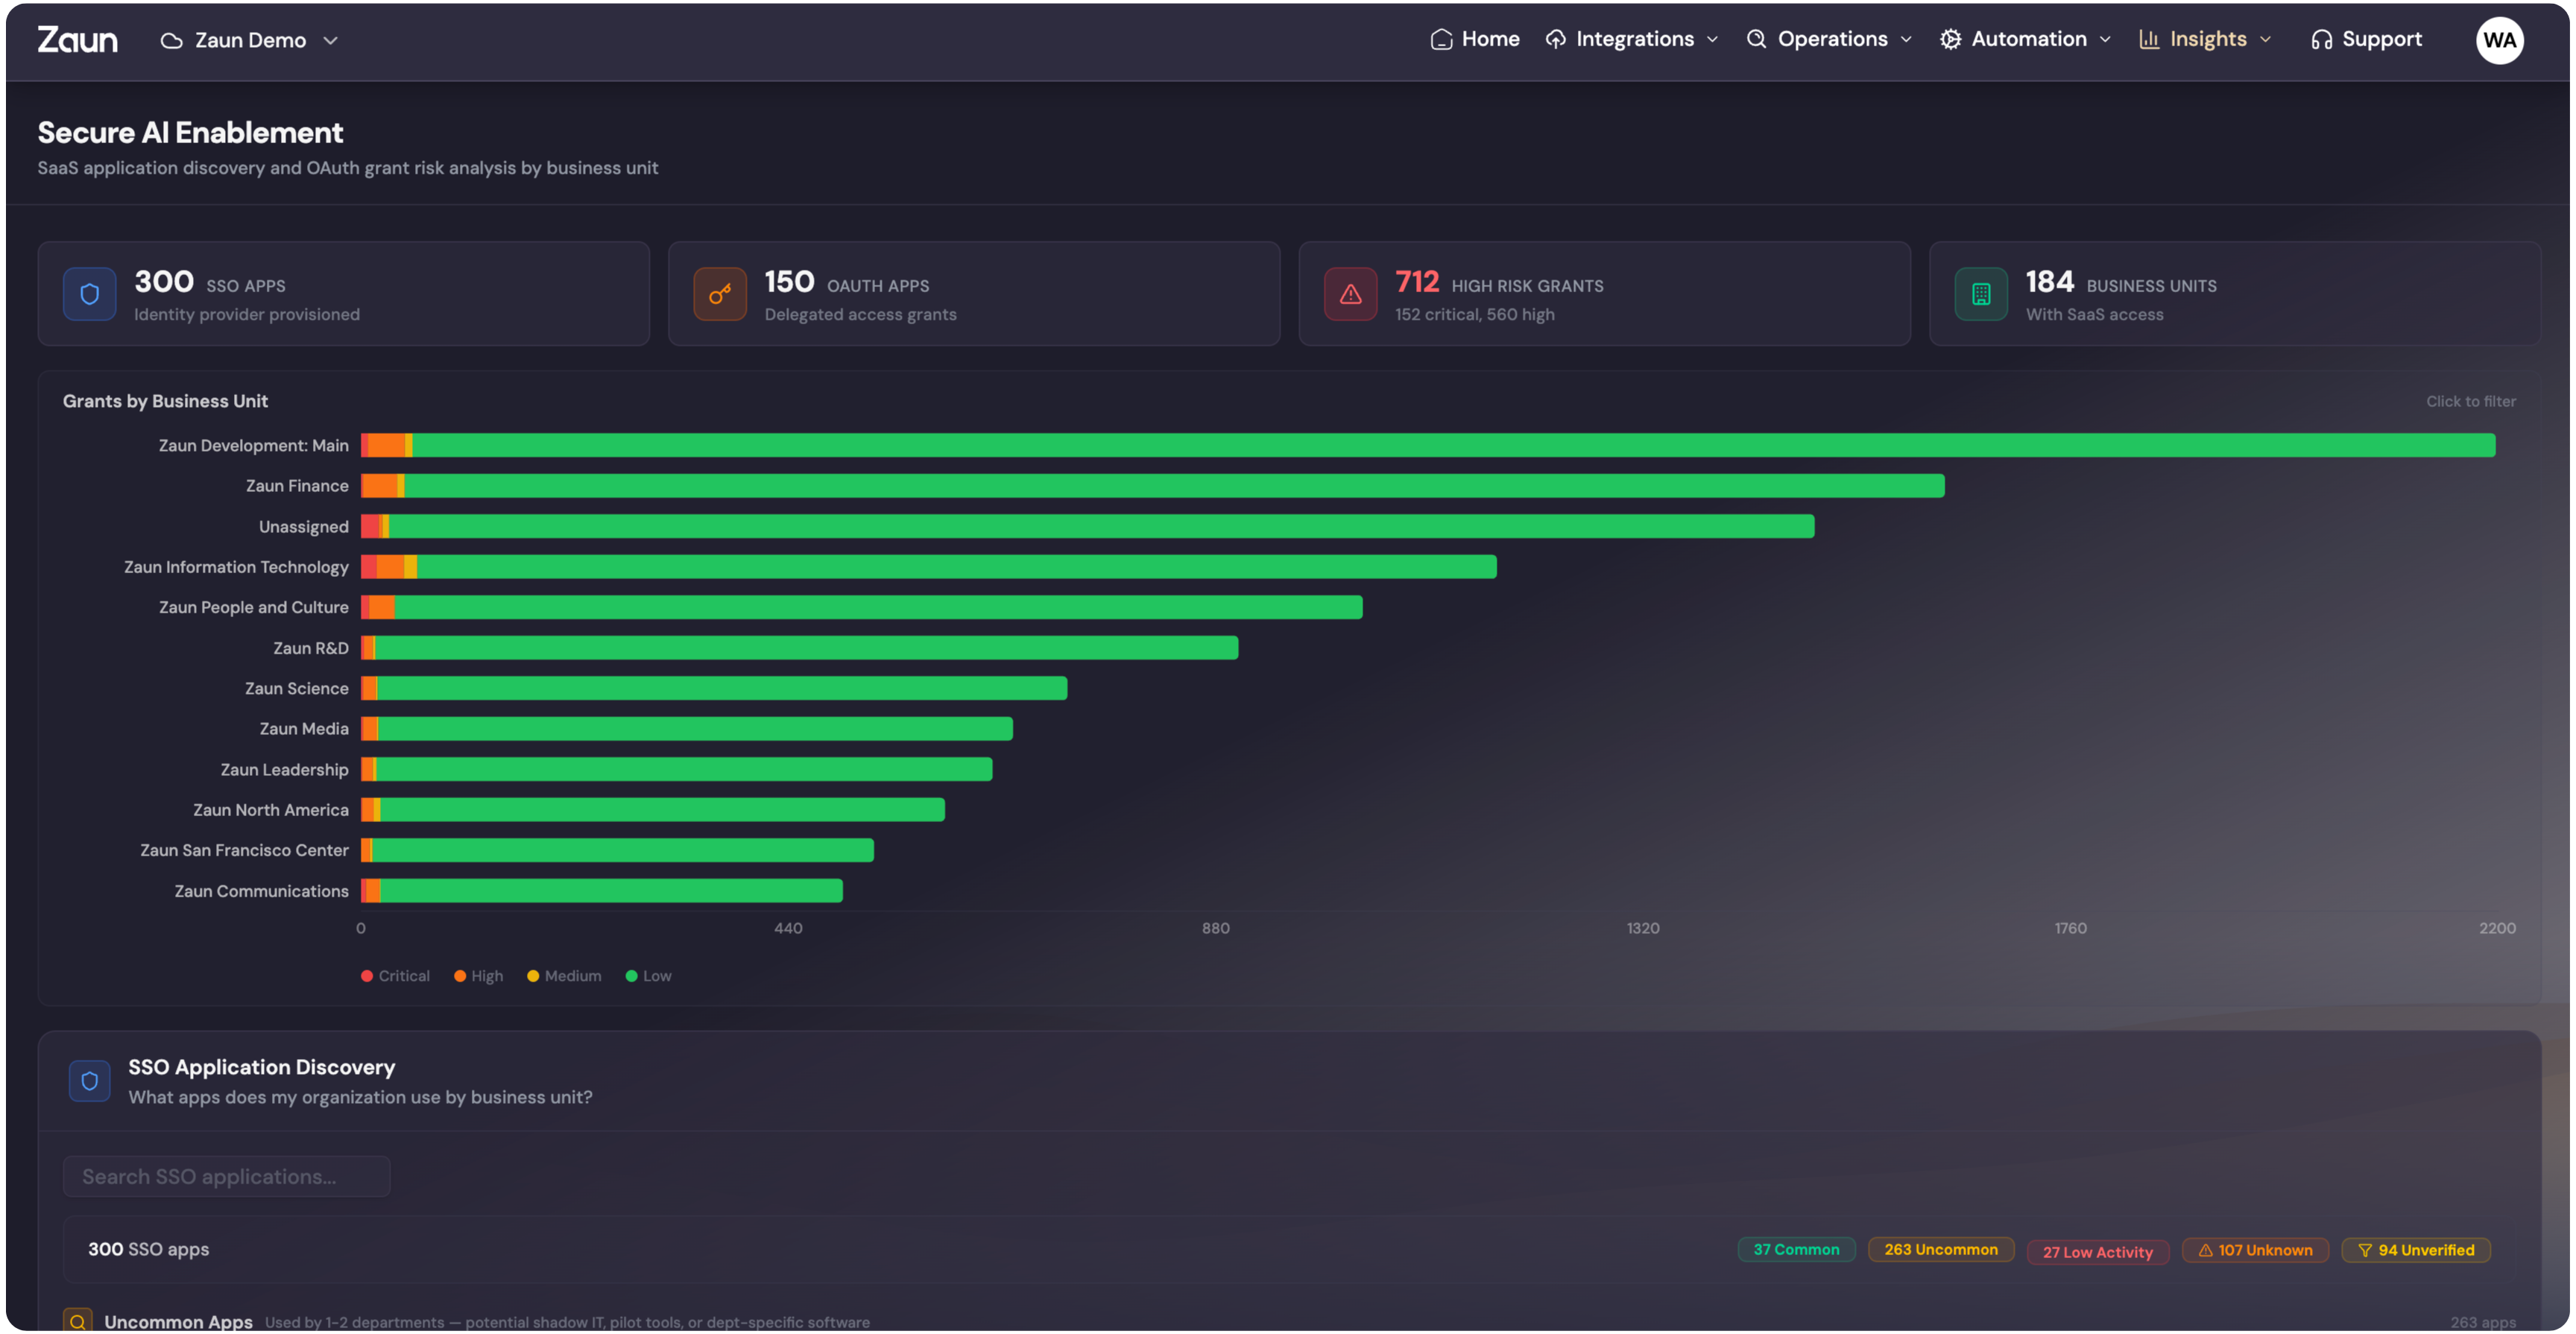
OAuth grant scanning. We pull OAuth grants from your identity provider and map out which AI services have been authorized, by who, and with what scopes. That engineer who gave Claude desktop full Google Drive read/write access three months ago? Found.
-
Email header analysis. AI tools leave fingerprints in email metadata. We parse headers to catch AI-generated content, automated replies, and AI service notification traffic flowing through your mail system.
-
Network traffic inspection. We identify API calls to AI service endpoints across your network, including tools that bypass SSO completely. Direct API usage, browser extensions, CLI tools calling OpenAI and Anthropic endpoints. All of it.
-
User attribution. Every discovered AI interaction gets mapped back to a specific person, team, and department. Who is using what, when they started, and how much data they're sending.
What You Get
A living inventory of AI usage across your org. Not a point-in-time audit that's stale by the time the PDF lands. A map that updates as new tools get adopted and usage patterns change.
Stage 2: Enforce. Set the Rules. We Enforce Them.
Knowing what's out there is step one. Actually controlling it is step two. This is where you define acceptable use policies and we enforce them in real time.
Policy-Driven Governance
Write acceptable use policies scoped by tool, team, and data classification. We connect to provider admin consoles and block sensitive data flows as they happen.
To make this concrete, take Claude Code as an example. It's one of the most capable AI coding tools out there, and it's also one of the hardest to govern.
Governing Claude Code in Practice
Claude Code can execute arbitrary shell commands, read any file on disk, and interact with your entire dev environment. That's the whole point. It's also why security teams lose sleep over it.
With our policy engine, you write rules like:
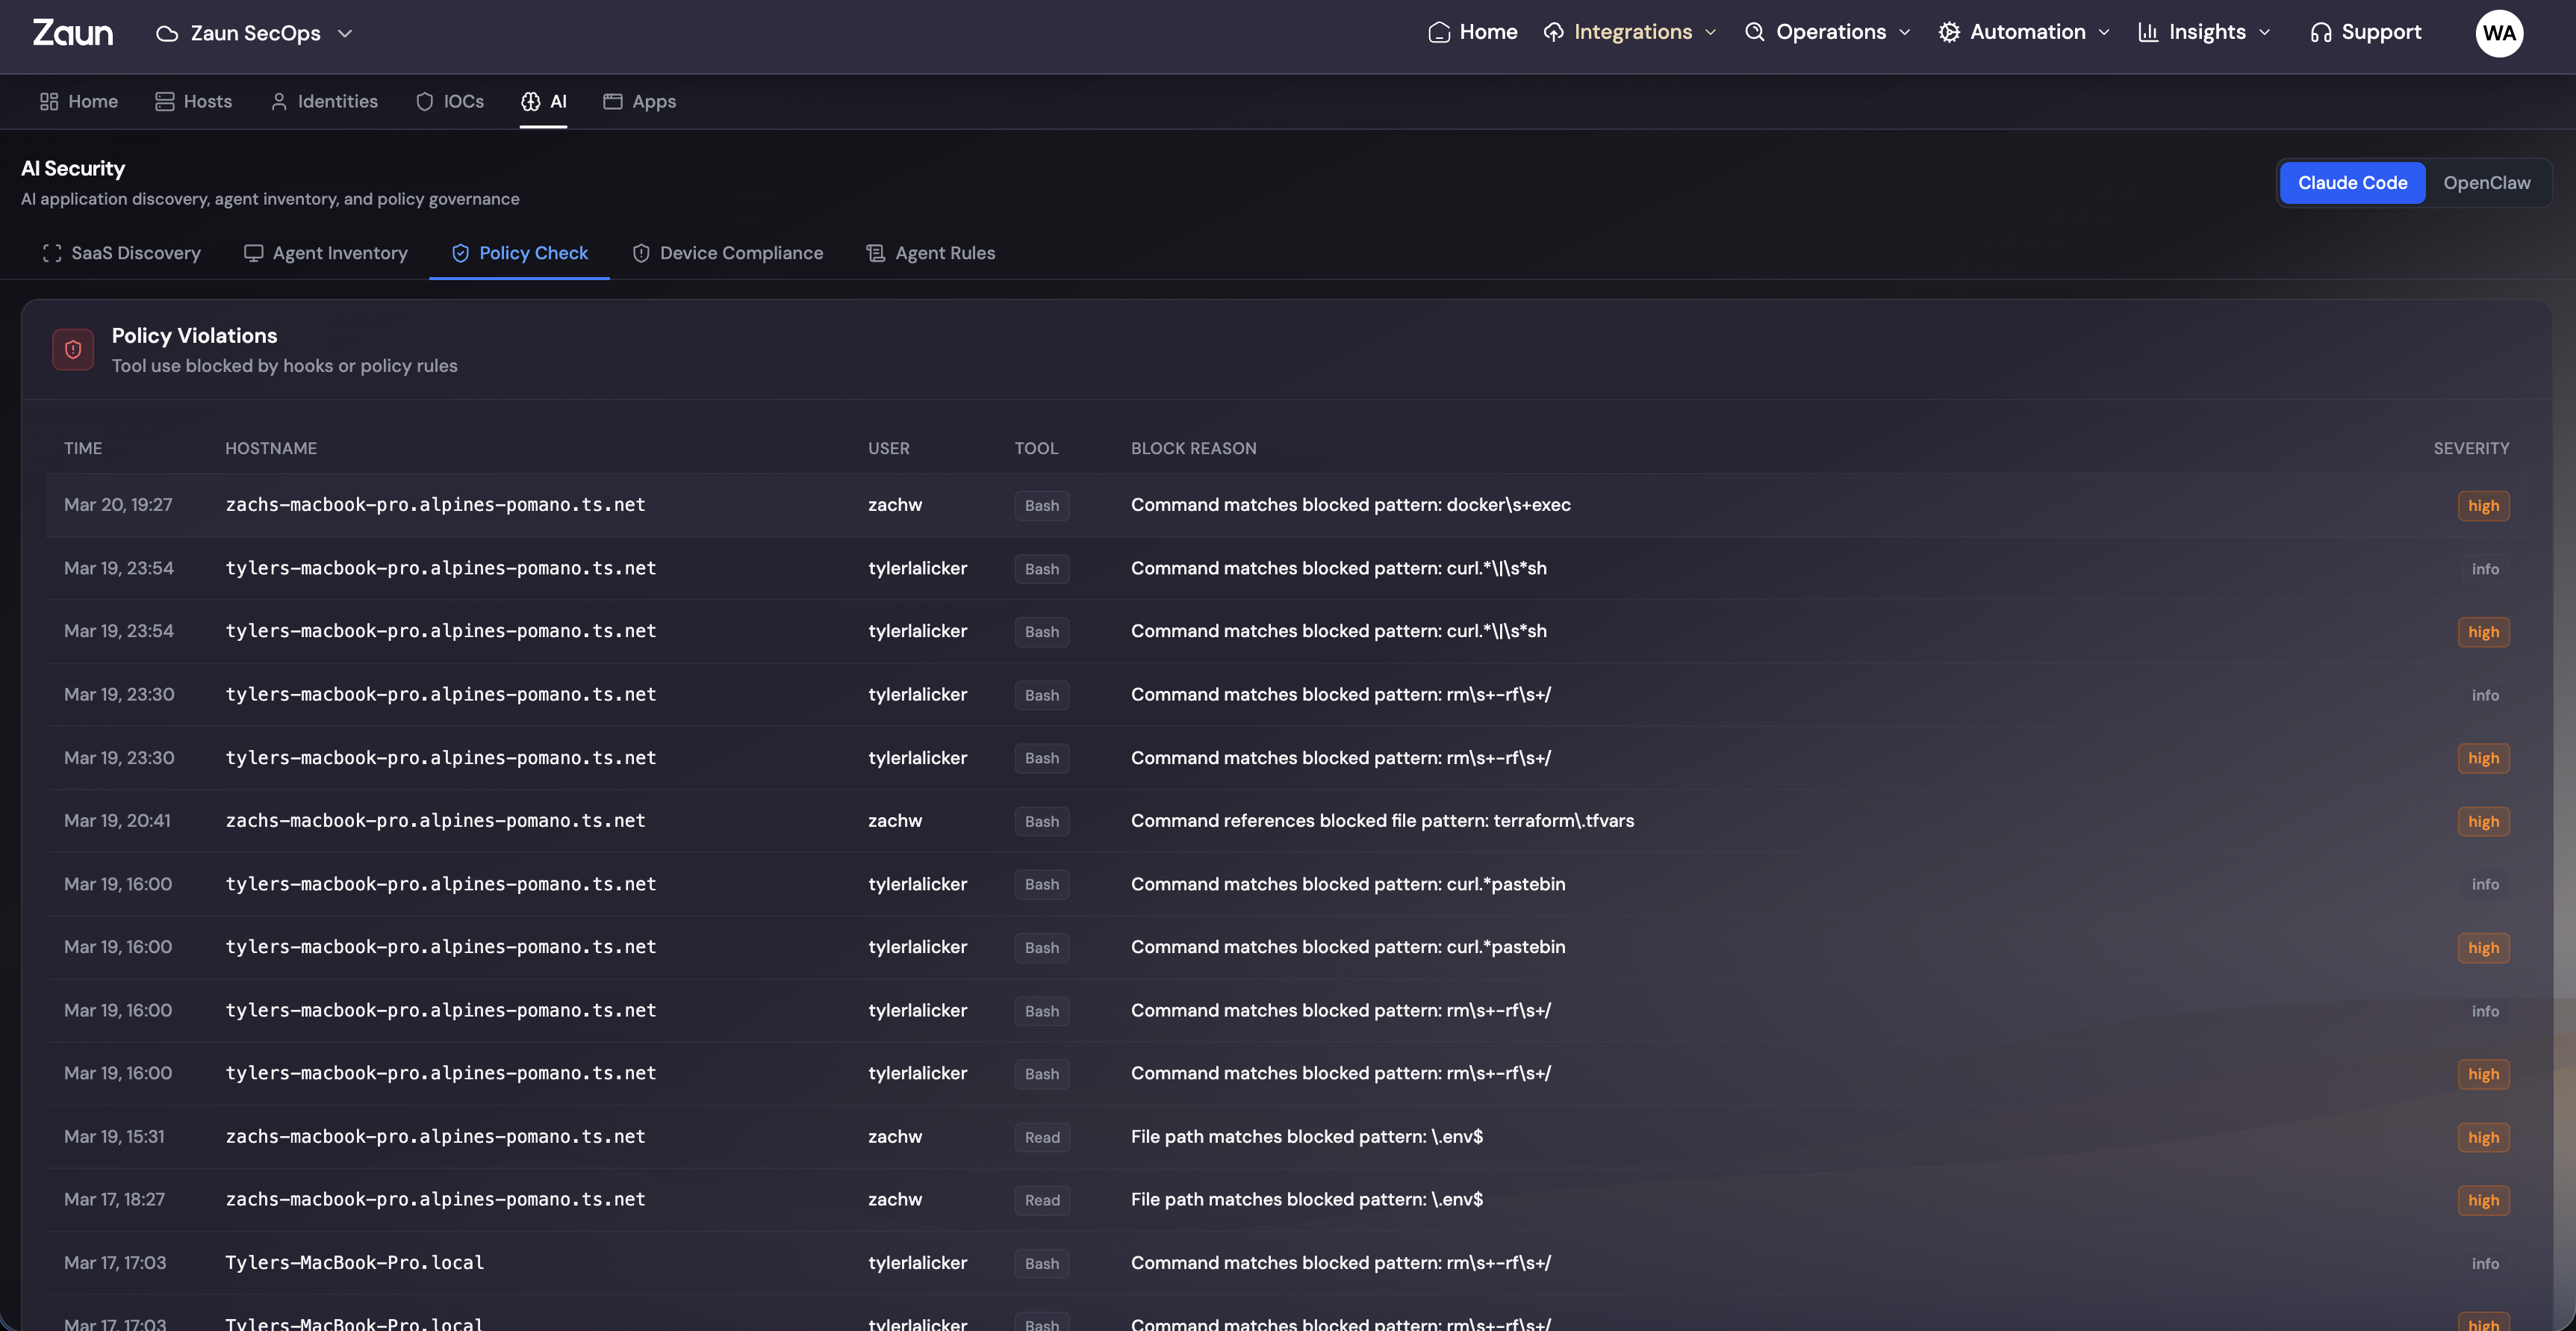
Preventing destructive CLI patterns:
- Block commands matching dangerous patterns like
rm -rf /,DROP TABLE, orchmod 777 - Flag and block recursive deletion commands targeting sensitive directories
- Prevent force-push operations to protected branches
Protecting secrets and credentials:
- Block reads on
.envfiles, AWS credential files, and SSH keys - Prevent API keys and tokens from being included in prompts or outputs
- Flag attempts to access secret management systems like Vault or AWS Secrets Manager
Data classification enforcement:
- Prevent PII or PHI from being sent to AI services
- Block code containing database connection strings from leaving the environment
- Enforce that proprietary source code only goes to approved AI tools

Real-Time Enforcement
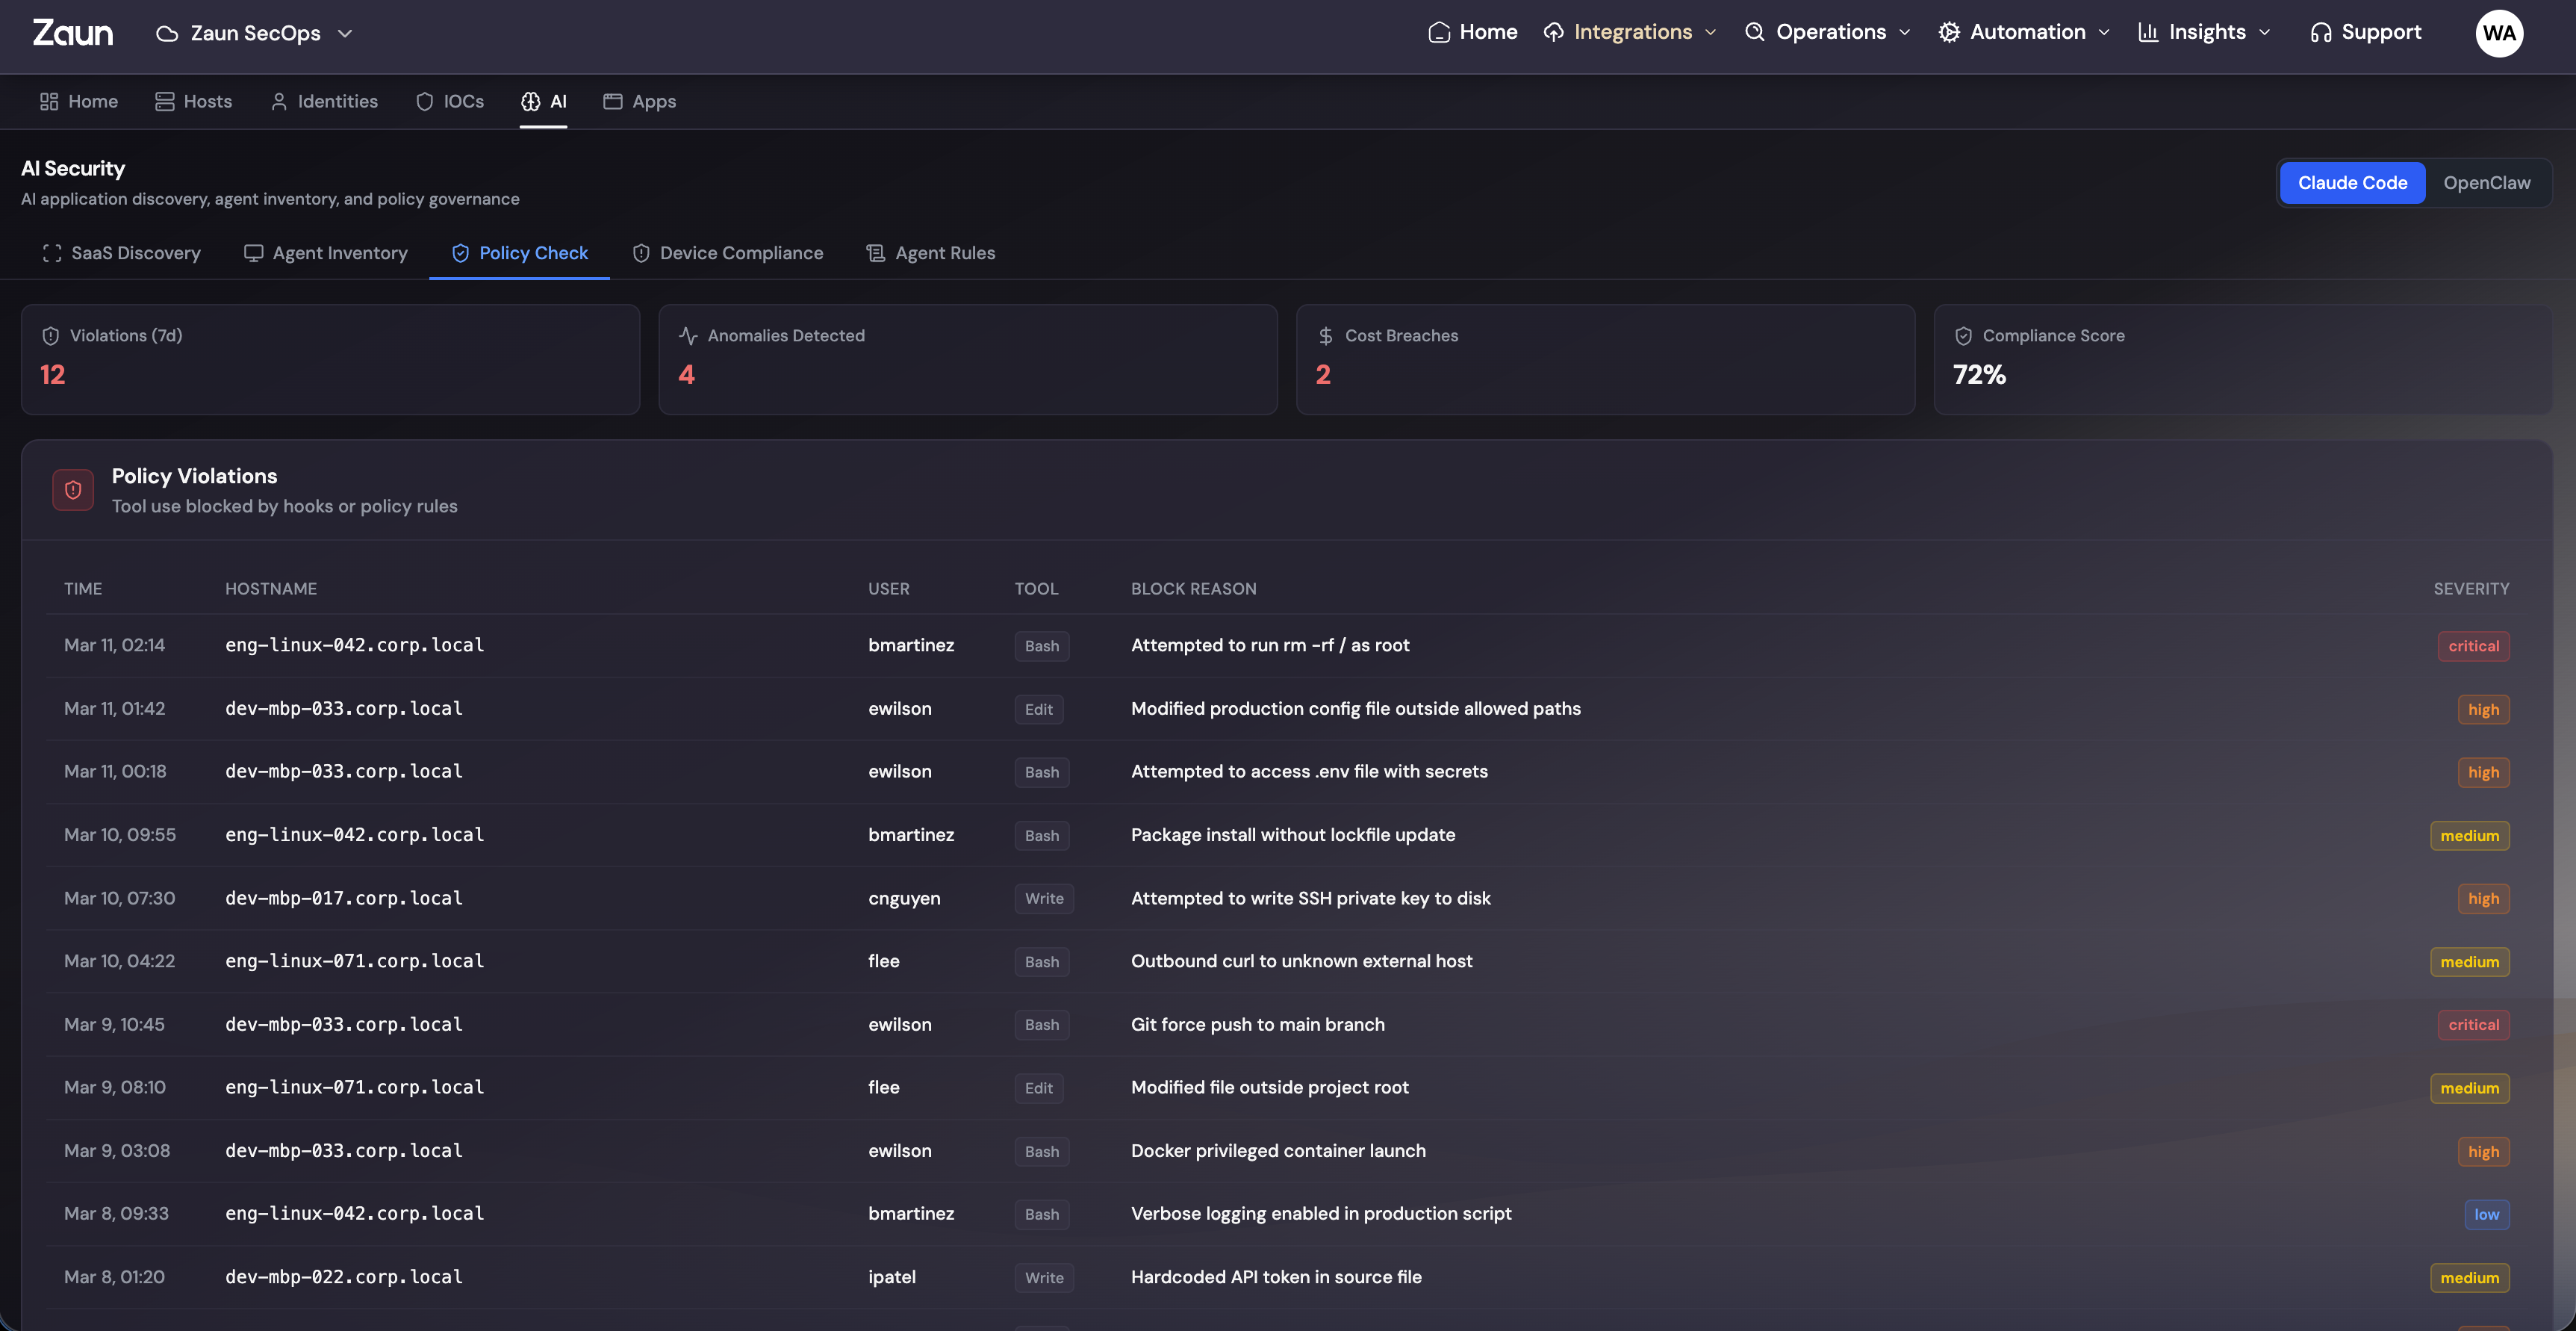
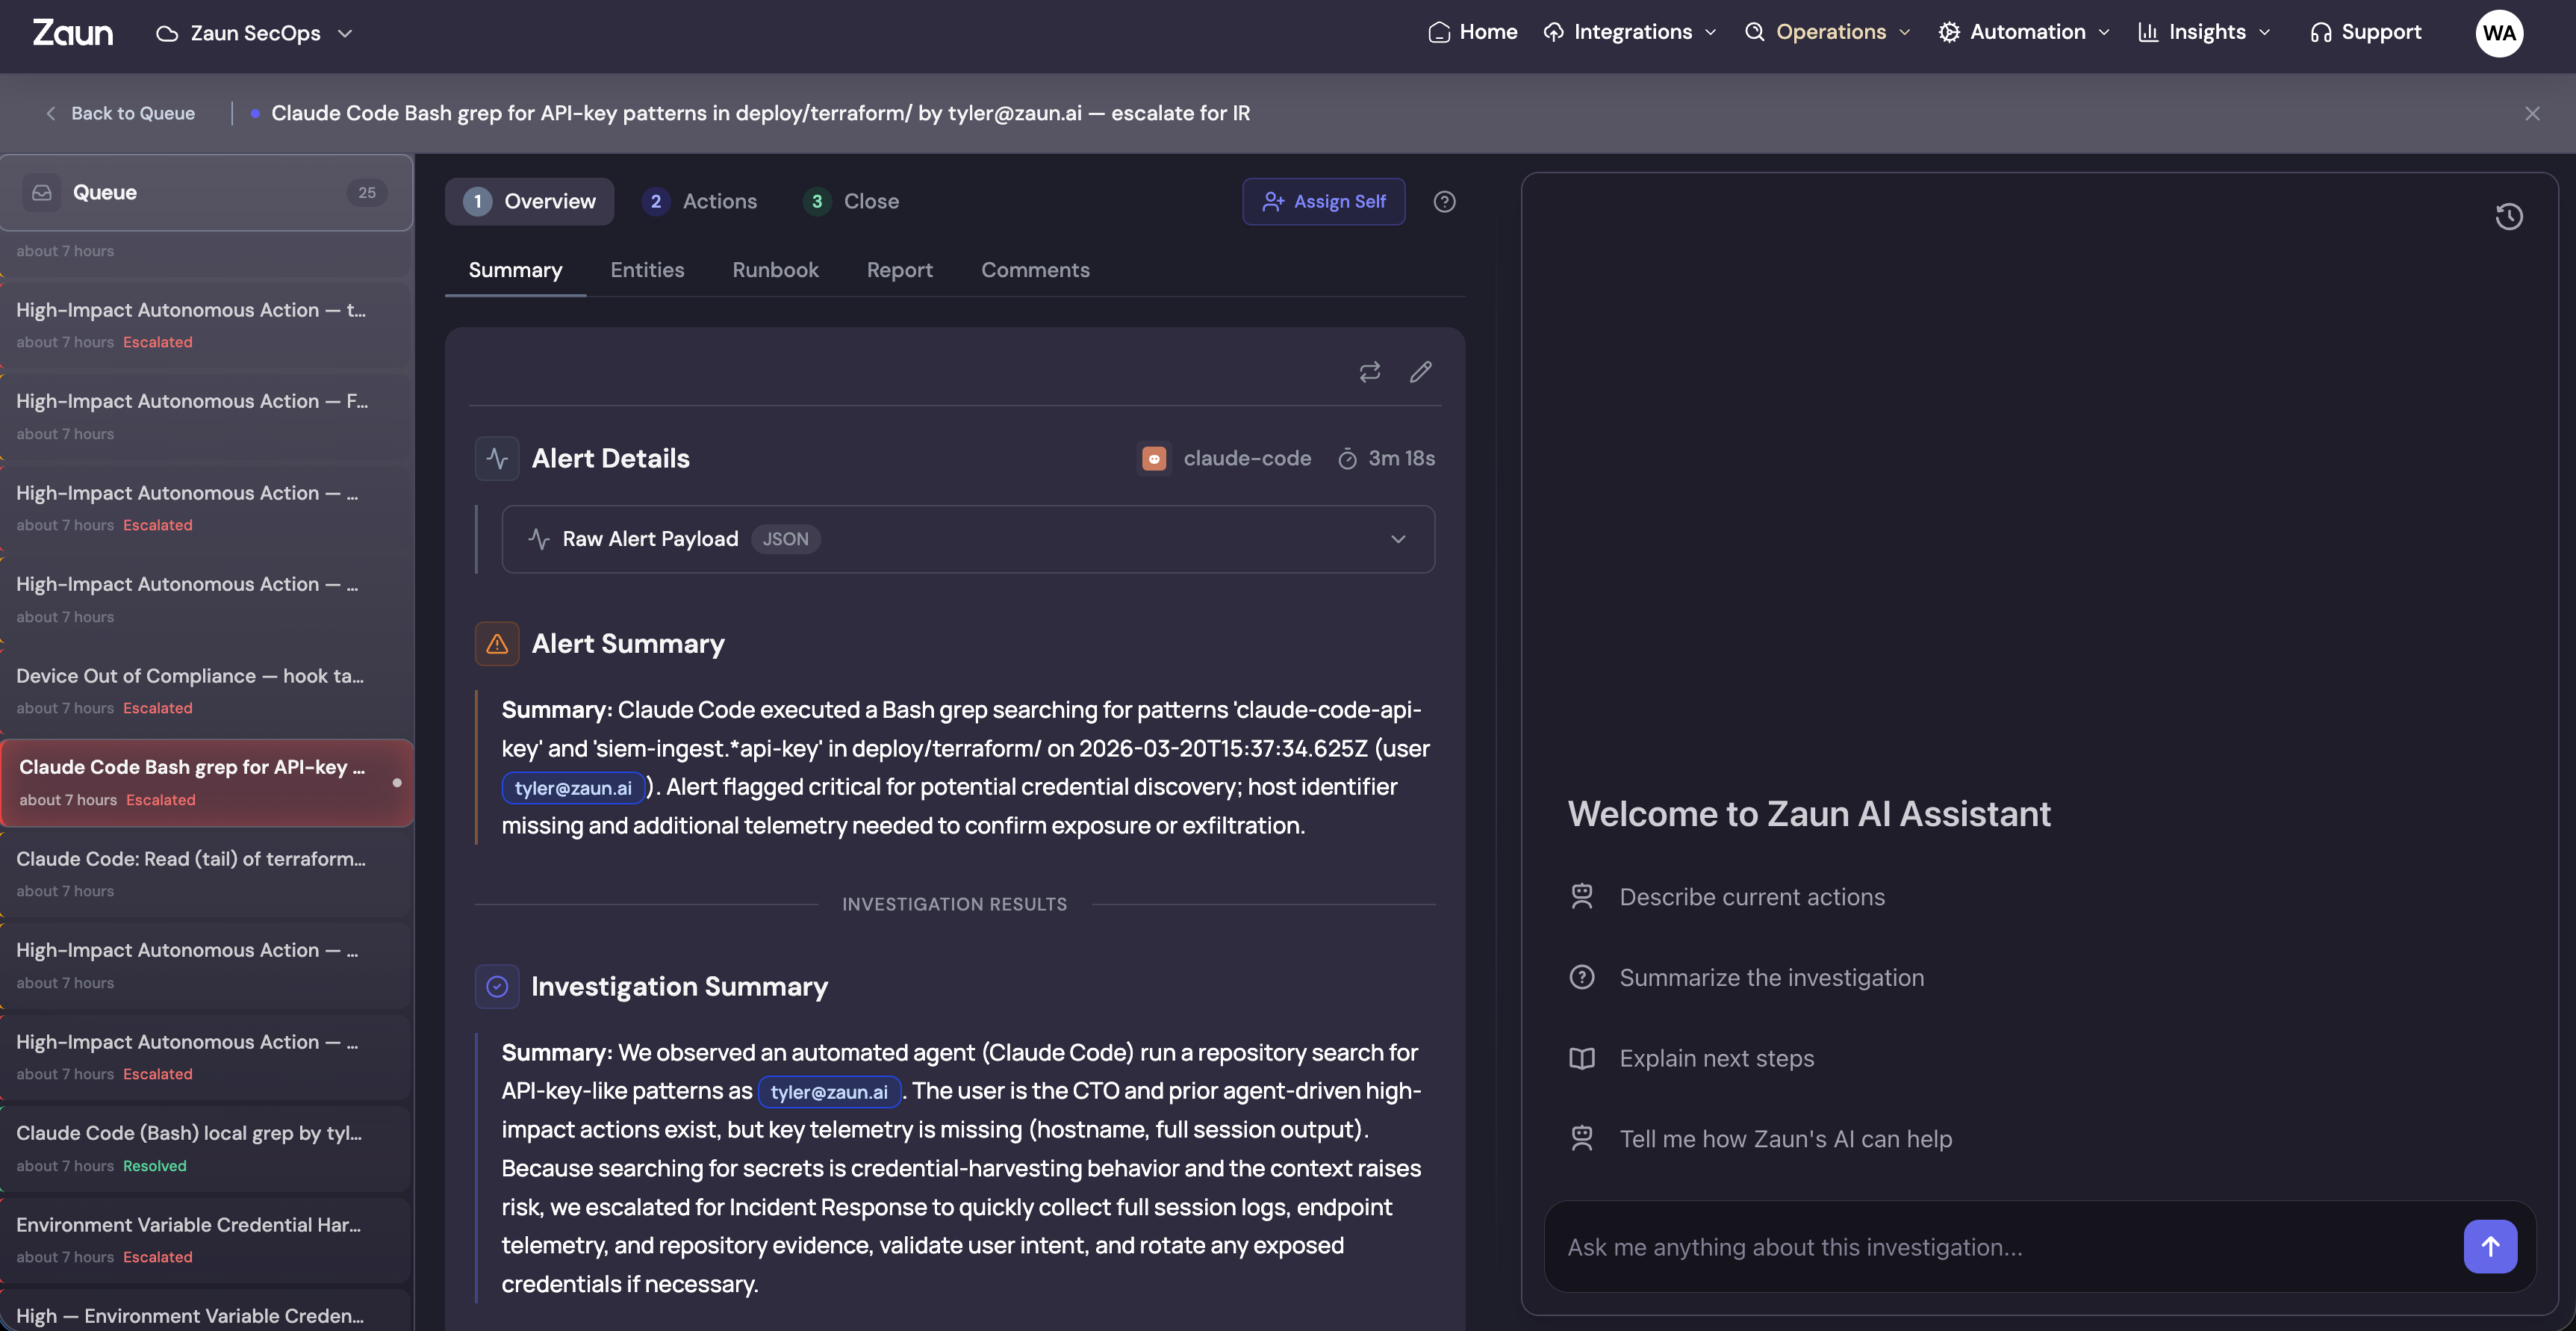
These aren't policies that sit in a wiki. When someone hits a violation:
- The action is blocked immediately
- The user sees a clear explanation of what triggered the block
- The security team gets an alert with full context
- The event is logged for compliance and audit
Stage 3: Monitor. Every Conversation. Every Action. Live.
Stage two handles the things you know are bad. Stage three catches everything you didn't think to write a policy for. This is live visibility into every AI agent conversation and action across your environment.
What We Monitor
-
MCP endpoint logging. We pull flow logs from MCP (Model Context Protocol) servers and agent endpoints. Every tool call, every context injection, every response. Captured and indexed.
-
Conversation monitoring. We track conversations across Claude, ChatGPT, Copilot, and Gemini. What data is being shared, what questions are being asked, what outputs are being generated.
-
Agent action tracking. When AI agents execute code, modify files, or call APIs, we capture the full action chain with before and after state.
-
Cross-source correlation. A single AI interaction often touches multiple systems. We correlate signals across identity, endpoint, network, and application logs to stitch together the full picture.
From Noise to Signal
Raw telemetry on its own is just noise. Our monitoring layer surfaces what actually matters:
- Anomalous usage patterns, like sudden spikes in data leaving through AI tools
- Policy drift, where teams gradually expand their AI permissions past what was approved
- Sensitive data exposure, such as PII, credentials, or proprietary code showing up in AI conversations
- Behavioral baselines, so you know what normal looks like and can spot when something isn't
Stage 4: Extend. Your Agents. Your Rules. Full Visibility.
Stages 1 through 3 cover the commercial AI tools everyone uses. Stage 4 is about your AI. The custom agents, the internal MCP servers, the AI-powered features your team is building right now.
The Custom Agent Problem
Every org building with AI looks different:
- A fintech running custom agents in their trading pipeline
- A healthcare company processing patient data through AI agents
- An engineering team with custom MCP servers wired into CI/CD
- An internal tool with an AI assistant that has access to production databases
Generic monitoring doesn't work for any of these. The architectures are different, the data flows are different, and the risks are different.
Forward-Deployed Engineering
This is why Stage 4 isn't a product you configure yourself. It's a forward-deployed engineer working directly with your team to build exactly what you need.
Custom policies. We sit down with you and define what your agents can and can't do. Boundaries around data access, action execution, and external communication. Policies that map to your specific risk framework, not a generic template.
Custom monitoring. We instrument your MCP servers and agent endpoints for full telemetry. We build dashboards around your specific agent architecture and define anomaly baselines based on how your agents are supposed to behave.
Custom response workflows. We build incident response playbooks specific to your AI agents. Escalation paths that match your team structure. Automated containment actions designed for your environment.
Everyone's setup is different. That's the whole point. You get monitoring and governance that fits your stack, not the other way around.
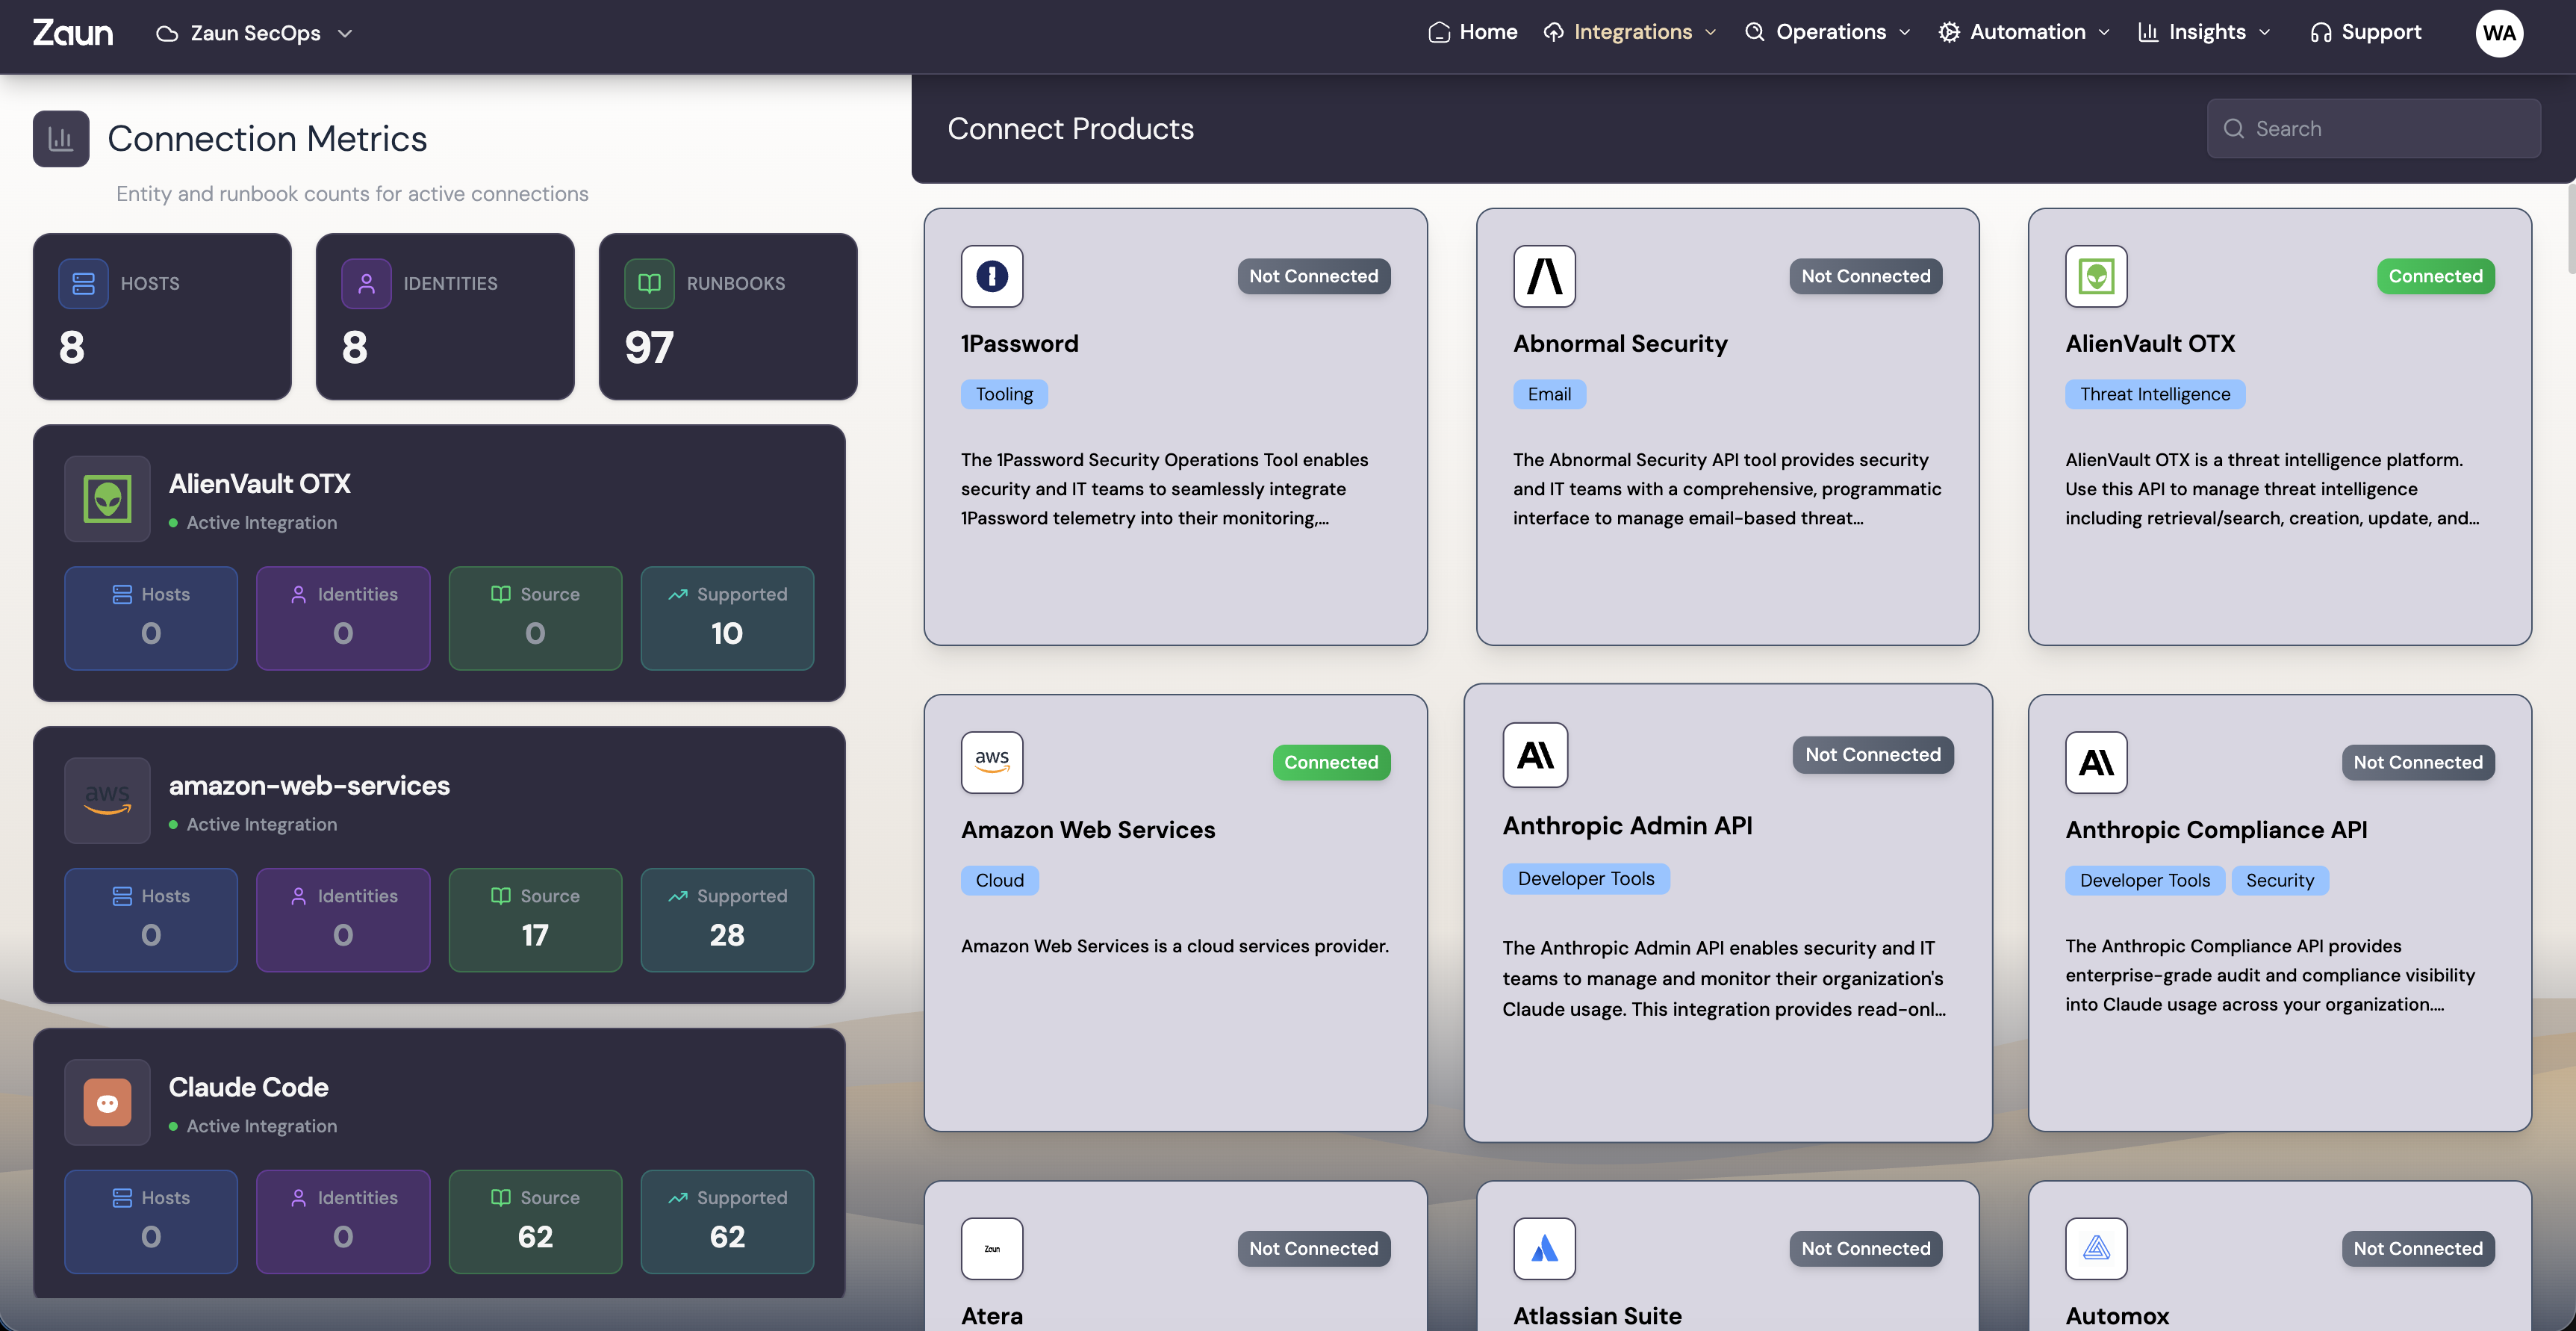
Connected to Everything
Your agents don't run in a vacuum and neither does our monitoring. We plug into the tools you already use:
- Alerting: PagerDuty, Slack, Opsgenie, custom webhooks
- SIEM: Splunk, Sentinel, Elastic, CrowdStrike
- Ticketing: Jira, ServiceNow, Linear
- Identity: Okta, Azure AD, Google Workspace
- CI/CD: GitHub Actions, GitLab, Jenkins
Every agent action, policy violation, and anomaly flows into the systems your team already lives in.
Why Now
Your teams aren't going to slow down on AI adoption. Every week there's a new tool, a new agent, a new integration touching more data and more systems. Without governance, you're stacking risk at the same pace.
The orgs that get this right won't be the ones that clamp down and say "no AI." They'll be the ones that build the infrastructure to move fast while keeping full visibility.
That's what we built. Four stages. Full coverage. Shadow AI to governed AI.
Get Started
AI Agent Monitoring is available now. Whether you need to figure out what's running, lock down tools like Claude Code, or get visibility into custom agents, we'll start wherever you are.